When I worked at Farecast we had a giant TV in the lobby, and up on that TV was an image of a globe, and on that globe were animated paths that (as far as you know) corresponded to flight searches that people were doing on the site. It was a big hit with visitors to the office, and I've always wanted to recreate it myself.
These days I don't have access to flight search data, but I do have access to (a subset of) the Twitter firehose, some subset of which is tweets tagged with geographic data. Hence today's stupid project:
Trump Tweets on a Globe
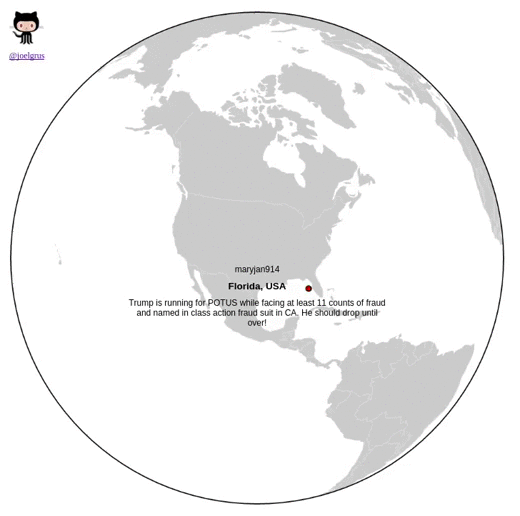
It streams tweets about Donald Trump (or whatever other topic you want), keeps only the ones that contain geo information, and then plots them on a globe.
(all code on GitHub, same as always)
And if anyone from the Trump campaign wants to hire me to build stupid junk like this for them, I'm available!
The Client
There is a saying (that I made up):
Good data scientists copy from the d3 gallery; great data scientists steal from the d3 gallery.
Accordingly, most of the visualization guts are shamelessly cribbed from Mike Bostock's World Tour visualization. (Which infected my code with the GPL, which I guess is the point of the GPL.)
His version has a list of countries that it simply rotates through in order, while ours needs to react to Tweets as they arrive.
My first attempt was to simply stick all of the Twitter logic in the client
and browserify it together, but that didn't work for cross-origin reasons, so I ended up having to stick the Twitter piece
on the server.
Then, because it seemed like the sensible thing to do, I decided that the server should maintain a single Twitter client and use socket.io to send tweets to the browser. (I have never really used socket.io before, so it's possible/likely I'm doing so in a really stupid way.)
The relevant part of the original visualization is (comments added by me):
(function transition() {
  d3.transition()
      // Start a 1.25 second transition.
      .duration(1250)
      // Increment `i` and set the title to the relevant country name.
      .each("start", function() {
        title.text(countries[i = (i + 1) % n].name);
      })
      // Rotate the globe to put that country in front.
      .tween("rotate", function() {
        var p = d3.geo.centroid(countries[i]),
            r = d3.interpolate(projection.rotate(), [-p[0], -p[1]]);
        return function(t) {
          projection.rotate(r(t));
          // Clear the canvas
          c.clearRect(0, 0, width, height);
          // Fill the land gray
          c.fillStyle = "#ccc", c.beginPath(), path(land), c.fill();
          // Fill the selected country red
          c.fillStyle = "#f00", c.beginPath(), path(countries[i]), c.fill();
          // Draw the country borders in white
          c.strokeStyle = "#fff", c.lineWidth = .5, c.beginPath(), path(borders), c.stroke();
          // Circle the globe in black
          c.strokeStyle = "#000", c.lineWidth = 2, c.beginPath(), path(globe), c.stroke();
        };
      })
    // Start a new transition that does nothing and then recursively calls
    // transition() to move to the next country.
    .transition()
      .each("end", transition);
})();
How should we modify this? Well, first, we need to open a socketio connection
to receive tweets.
var socket = io({ "force new connection" : true });
And then instead of having our transitions triggered by an IIFE
that calls itself recursively, we invoke a transition whenever we receive a
'tweet' message over the socket:
socket.on('tweet', function(tweet) {
  console.log(tweet);
  d3.transition()
    .duration(1250)
    .each("start", function() {
      title.html(makeHTML(tweet));
    })
    .tween("rotate", function() {
      var p = tweet.latLong,
          r = d3.interpolate(projection.rotate(), [-p[0], -p[1]]);
      return function(t) {
        projection.rotate(r(t));
        c.clearRect(0, 0, width, height);
        c.fillStyle = "#ccc", c.beginPath(), path(land), c.fill();
        c.strokeStyle = "#fff", c.lineWidth = .5, c.beginPath(), path(borders), c.stroke();
        c.strokeStyle = "#000", c.lineWidth = 2, c.beginPath(), path(globe), c.stroke();
        var center = projection(p);
        c.strokeStyle = "#000", c.fillStyle = "#f00", c.beginPath(), c.arc(center[0], center[1], 5, 0, 2 * Math.PI, false), c.lineWidth = 2, c.fill(), c.stroke();
      };
    });
});
The major differences here are
- instead of using
title.text()to set the country name, we usetitle.html()to create more complex HTML (see below) - instead of getting the "front and center" coordinates from the array of countries,
we get them from the
latLongfield of the tweet message. - we add an extra drawing to the canvas -- a filled-in circle at the
latLongcoordinates, after we useprojectionto convert them into the canvas coordinate system - there's no recursive call at the end, since the transition will get invoked again every time there's socket message.
Otherwise it's the same! (I had to add some more CSS as well.)
We still need to write the function that makes HTML:
function makeHTML(tweet) {
  return [
    '<div class="user">',
    '<a href="https://twitter.com/', tweet.user, '" target="_blank">', '@', tweet.user, '</a>',
    '<h1>', tweet.placeName, '</h1>',
    '<div class="tweet">',
    '<a href="https://twitter.com/', tweet.user, '/status/', tweet.id, '" target="_blank">',
    tweet.text, '</a>', '</div>'
  ].join('');
}
It's really ugly (my kingdom for a templating engine!) but all it's doing is showing the Twitter user name (with a link), the place name of the specified location, and the text of the tweet (With a link).
The Server
OK, now we're ready to deal with the server. It will do a few things:
- Serve up our
index.htmlpage. - Subscribe to some topic on the Twitter streaming API.
- Massage the returned tweets and publish them to socketio.
As always, you'll need to get some Twitter credentials and set them up in a
credentials.js that looks like
module.exports = {
  consumer_key: "...",
  consumer_secret: "...",
  access_token_key: "...",
  access_token_secret: "..."
};
And then our server is actually not that complicated. Let's start out with all the express boilerplate:
var express = require('express'),
    app = express(),
    http = require('http').Server(app);

// Serve index.html at the root.
app.get('/', function(req, res){
  res.sendFile(__dirname + '/index.html');
});

// Serve static files in the public directory.
app.use(express.static('public'));

// Run on port 3000.
http.listen(3000, function() {
  console.log('listening on 3000');
});
Now, because we're working in Javascript, we've got async stuff everywhere.
In particular, we'll need to give our Twitter client a callback function that
triggers whenever a new tweet is received. In my first version that callback
function published to socket.io directly. For reasons I can't precisely explain to you,
that struck me as too tight of a coupling, so I introduced an intermediate
TweetEmitter:
// This is all OO-boilerplate-cruft to make my own event emitter.
// https://nodejs.org/api/events.html
var EventEmitter = require('events'),
    util = require('util');

function TweetEmitter() {
  EventEmitter.call(this);
}
util.inherits(TweetEmitter, EventEmitter);

var tweetEmitter = new TweetEmitter();
There's pretty much nothing going on here. The Twitter client will send its
tweets to the TweetEmitter, and the socketio socket will grab tweets from the
TweetEmitter and that way they don't have to know about each other, which felt
like the right design.
At this point it's easy to hook the TweetEmitter up to socket.io:
var io = require('socket.io')(http);

tweetEmitter.on('tweet', function(tweet) {
  console.log(tweet);
  io.emit('tweet', tweet);
});
Finally we need to set up the Twitter client.
There is a slight complication here, in that there are several ways in which a
tweet might specify its geography. A tweet has a geo field, which I believe
is deprecated. It has a coordinates field, which is rarely populated. And it
has a place field, which (is sometimes populated and if so)
contains a rich object.
For our purposes the most interesting properties of place are
full_name: we'd like to display it on our globe, andbounding_box.coordinates: an array of arrays of (longitude, latitude) pairs.
(I assume it's an array of arrays because the "bounding box" might comprise multiple polygons? I'm not sure.)
Anyway, we just want to put a dot at a single location, which we'll accomplish by averaging all of the coordinate pairs:
// a helper function to average coordinate pairs
function average(coordinates) {
  var n = 0, lon = 0.0, lat = 0.0;
  coordinates.forEach(function(latLongs) {
    latLongs.forEach(function(latLong) {
      lon += latLong[0];
      lat += latLong[1];
      n += 1;
    })
  });
  return [lon / n, lat / n];
}
(Yes, I am aware that I called them latLongs even though the longitude is
first. I always do that, it's a character flaw.)
Next we setup Twitter and get our search term from the command line args if
appropriate (or just use trump as the default):
var Twitter = require('twitter'),
    credentials = require('./credentials.js'),
    client = new Twitter(credentials);

var query = process.argv[2] || 'trump';
And finally we start listening to the streaming API:
client.stream('statuses/filter', {track: query}, function(stream) {
  // Every time we receive a tweet...
  stream.on('data', function(tweet) {
    // ... that has the `place` field populated ...
    if (tweet.place) {
      // ... extract only the fields needed by the client ...
      var tweetSmall = {
        id: tweet.id_str,
        user: tweet.user.screen_name,
        text: tweet.text,
        placeName: tweet.place.full_name,
        latLong: average(tweet.place.bounding_box.coordinates),
      }
      // ... and notify the tweetEmitter.
      tweetEmitter.emit('tweet', tweetSmall);
    }
  });
});
And that's all of it. If you've read this far, you can (maybe) see it up and running at
That's a tiny ec2 nano instance that's trying to socket.io with everyone who goes to that URL, so it will probably crash eventually, at which point you'll need to run it yourself locally.
So that's it. For once no Haskell, no PureScript, not even any Python, just clean old node and JavaScript.
Possible Improvements
As I mentioned above, this approach probably doesn't scale to very many users
before the backend just gets overwhelmed. So one obvious
improvement would be to scale it up. If I wanted to do that, my first attempt
would probably be to have one dedicated process publishing the tweets to a
(private) socket, and a bunch of express processes behind a load balancer,
each of them pulling tweets from the (private) socket and publishing them to
their clients. Conceptually that shouldn't be too hard, but it seems like more
devops work and/or AWS bill than I want to devote to a toy project at this point.
One person I showed it to wanted the tweets throttled, so that the globe updated more slowly. Personally, I like it the way it is. One approach would be to throttle things on the server side (only publish to the socket after a certain interval has passed), another would be on the client side (throw away messages until some interval has passed). In the second case you could even give the user a slider to choose the update speed.
Another person wanted a query box to select their own search terms. Unfortunately, that doesn't fit into this model -- the Twitter client needs a separate streaming connection to Twitter for each search term, and it defeats the point of sharing the single Twitter connection among all the connected clients.
It also might be fun to leave the dots and tweets on the globe for a while and have them slowly fade away. That seems like a lot more work. (Especially since the tweets aren't technically "on the globe", they're in a fixed spot.)
So anyway, check it out, check out the code, roll your own version, and if anyone from the Trump campaign is reading this, I wasn't kidding, call me!
Got any other ideas to improve it? Let me know!